
Type "what is a good HRV" into any search bar and you will get a confident-looking number. The trouble is that heart rate variability is one of the most individually variable metrics in all of physiology. Two healthy people the same age, same sex, same fitness level can have HRV numbers that differ by two or three times. So the honest answer to "what is a good HRV for my age" starts with a range, adds a large asterisk, and ends with the only comparison that actually matters: you against yourself.
This article gives you the ranges anyway, because people want them and they are useful for orientation. Then it explains what those ranges actually mean, why HRV drops as you get older, why your Oura number and your friend's WHOOP number are not comparable, and how to figure out what is normal for you specifically. If you want the deeper dive on what HRV measures and how to act on it in training, our heart rate variability training research piece covers that ground.
First, a quick definition, because the ranges only make sense once you know what is being measured.
What HRV Actually Measures
Your resting heart is not a metronome. If you measure the milliseconds between consecutive beats, they vary: 940 ms, then 910, then 955, then 925. That beat-to-beat variation is HRV. Counterintuitively, more variation is usually the healthy sign. It reflects an active vagus nerve applying and releasing the parasympathetic "brake" on your heart with each breath. The beats themselves are worth a look too, because resting heart rate behaves nothing like HRV across the decades: our review of resting heart rate by age shows it staying broadly flat through adulthood while HRV falls steeply.
The metric almost every consumer wearable reports as "your HRV" is RMSSD, the root mean square of successive differences between beats. When you see an HRV number on a ring or watch, it is nearly always RMSSD in milliseconds, measured overnight. Higher RMSSD means stronger vagal (recovery-side) activity. Lower RMSSD means the sympathetic "fight or flight" side is more dominant, whether from training load, poor sleep, alcohol, illness, or life stress.
Keep that in mind as you read the ranges below. They are all RMSSD in milliseconds, and the number describes autonomic balance, not how "fit" or "healthy" you are in any simple way.
Typical HRV (RMSSD) Ranges by Age
The table below shows typical overnight RMSSD ranges by decade, drawn from published consumer-wearable member data (WHOOP's published age chart) alongside the peer-reviewed healthy-adult reference from Nunan et al. (2010). Treat these as orientation, not diagnosis. The "typical" column is roughly the middle half of people in each band, which means a lot of healthy people sit above or below it.
| Age band | Typical overnight RMSSD (ms) | What it means |
|---|---|---|
| 18 to 25 | ~55 to 105 | Highest HRV of adult life; wide spread between individuals |
| 26 to 35 | ~50 to 90 | Still high; the decline is gradual and easy to miss |
| 36 to 45 | ~40 to 75 | Noticeable drop from the 20s begins to show |
| 46 to 55 | ~35 to 60 | Continued decline; lifestyle and fitness matter more |
| 56 to 65 | ~25 to 50 | Lower baseline is normal; training helps preserve it |
| 65+ | ~25 to 45 | Decline flattens; trend still tracks recovery |
Notice how much the bands overlap. A 60-year-old at the top of their range (around 45 to 50 ms) can have a higher HRV than a 30-year-old at the bottom of theirs (around 45 to 50 ms). That overlap is the whole reason cross-person comparison is a trap. The bands tell you roughly where you sit relative to your peers. They tell you nothing about whether your number is "good" for you.
The peer-reviewed anchor is worth holding onto. Nunan et al. (2010), a systematic review pooling 44 studies and 21,438 healthy adults in Pacing and Clinical Electrophysiology, put the average short-term RMSSD at about 42 ms with a normal range of 19 to 75 ms (SDNN, another common measure, averaged 50 ms with a range of 32 to 93 ms). That single reference range covers most healthy adults across a broad age span, which underlines the point: the "normal" window is enormous.
Why HRV Falls With Age
HRV declines with age because the autonomic nervous system ages along with everything else. Vagal control of the heart weakens, the respiratory-driven swing in heart rate shrinks, and RMSSD comes down. This is one of the most consistent findings in the whole HRV literature.
The classic dataset is Umetani et al. (1998) in the Journal of the American College of Cardiology, which measured 24-hour HRV in 260 healthy people spanning nine decades, from age 10 to 99. Two findings stand out:
- The steepest decline is early. Time-domain measures like RMSSD and pNN50 dropped most rapidly from the second decade to about the sixth decade, reaching roughly half of their young-adult baseline, then leveled off. The biggest single-decade fall showed up between the 20s and 30s.
- Sex differences shrink and disappear. Before age 30, women tended to have lower HRV than men on most measures. That gap narrowed through the 30s and 40s and had essentially vanished by age 50.
The review by Shaffer and Ginsberg (2017) in Frontiers in Public Health, which is the standard modern reference for HRV norms, summarizes the same pattern across multiple cohorts: a broadly linear decline in some measures and a steeper early drop in the vagal ones, with age the single strongest demographic predictor of resting HRV.
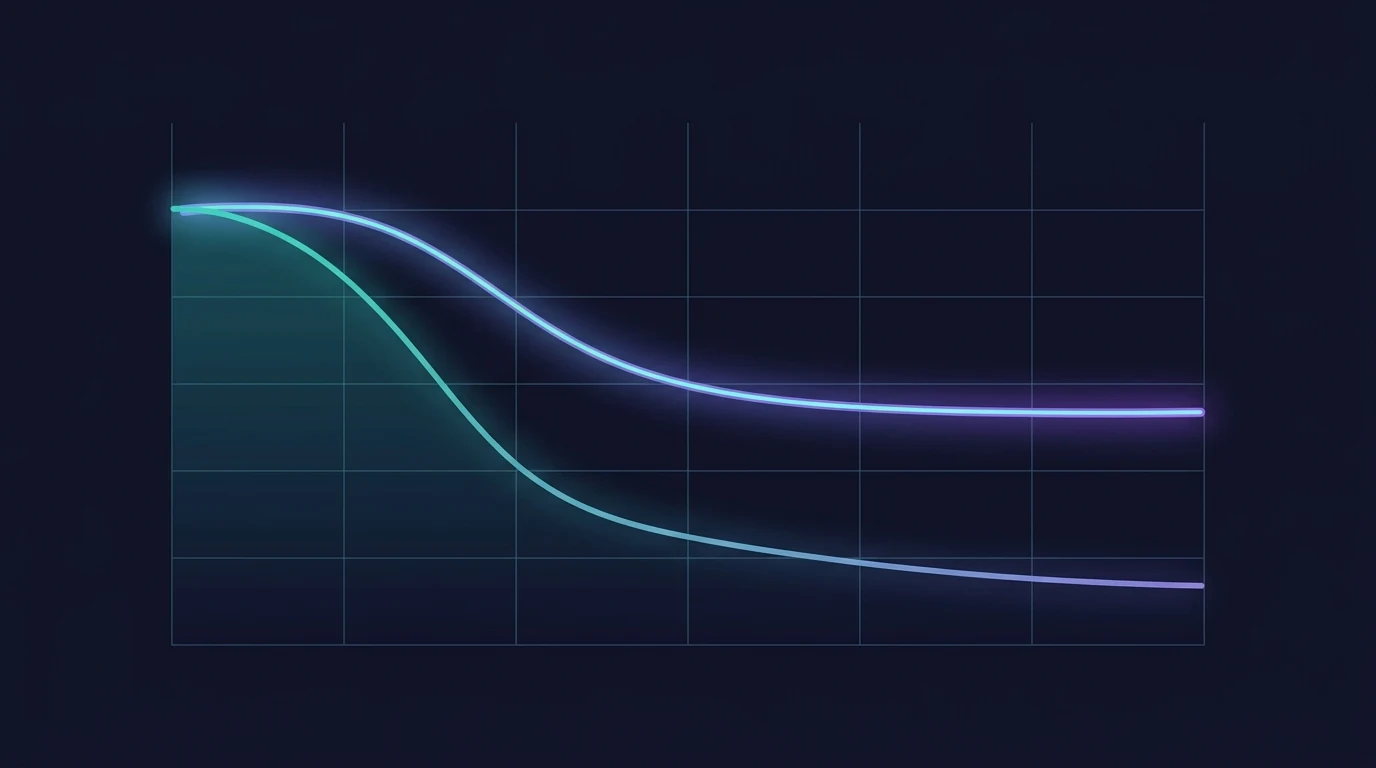
The encouraging part: the age decline is not fixed destiny. Aerobic fitness is associated with higher HRV at every age, and endurance-trained older adults often post HRV numbers that would look normal for someone decades younger. You cannot stop the clock, but consistent training, good sleep, and low alcohol intake meaningfully bend the curve. Our zone 2 training research piece covers the easy-aerobic work most associated with autonomic health.
Why Your Number Differs by Device
Here is where a lot of confusion starts. You read that a "good" HRV in your 30s is around 60 ms. Your Oura ring says 38. Your friend's WHOOP says 70. Nobody is broken. The devices are measuring different things at different times.
Published member data makes the gap obvious. Oura's own reporting puts the average member HRV at about 41 ms (roughly 40.3 ms for men and 41.5 ms for women). WHOOP's published averages run substantially higher, around 62 to 65 ms, in part because WHOOP emphasizes readings during slow-wave sleep, when HRV tends to be highest. Same underlying physiology, very different reported number, purely because of measurement method and timing.
Accuracy also varies by sensor. Dial et al. (2025) in Physiological Reports validated five wearables against a research-grade ECG across 536 nights. Finger-ring sensors tracked the reference most closely for HRV (concordance correlation around 0.97 to 0.99, mean absolute percentage error roughly 6 to 7 percent), a chest-strap-adjacent device was moderately accurate, and wrist watches were the least consistent. So not only do brands report different numbers, some measure the underlying signal more faithfully than others.
The takeaway is not "find the most accurate device and chase its number." It is simpler: pick one device, wear it consistently, and only ever compare its readings to its own history. Cross-brand and cross-person comparisons are meaningless. Your within-device trend is the whole game. We go deeper on this in why recovery scores differ between devices.
Get an evidence-based plan built for you
FitCraft, our mobile fitness app, pairs you with an AI coach who builds you a personalized plan around your goals, schedule, and fitness level. Every FitCraft program is designed by Domenic Angelino, MPH (Brown University) and NSCA-CSCS, with research published in the Journal of Strength and Conditioning Research and Medicine & Science in Sports & Exercise.
Take the Free Assessment Free • 2 minutes • No credit cardHow to Find What Is Good for You
Since the population ranges are so wide, the practical work is building your own baseline. Here is the protocol the research supports.
1. Measure consistently. Same conditions every time. Overnight or first thing on waking, before caffeine, before you check your phone. Wearables that measure automatically during sleep handle this for you, which is one reason overnight numbers are more stable than spot checks.
2. Give it 30 to 60 days. Your first month of data is not for making decisions. It is for establishing your personal normal range. Only once you have a month or two of readings does "high for me" or "low for me" mean anything.
3. Watch the 7-day rolling average, not the daily number. A single morning reading is dominated by last night's sleep, alcohol, and stress. The rolling weekly average is what actually tracks your recovery and training state. If your weekly average holds steady inside your normal band, you are recovering fine.
4. Interpret drops as trends, not alarms. One low morning means nothing. A weekly average that sits well below your baseline for two-plus weeks, while training has not increased, is a real signal that fatigue, stress, or illness is accumulating.
5. Never compare to anyone else. Not your partner, not a forum stranger, not a published average. Age, genetics, body size, and device all move the number. You versus you, always.
Common Misconceptions
Misconception 1: "There is a target HRV I should hit"
There is not. The normal range across healthy adults spans roughly 19 to 75 ms for RMSSD (Nunan et al., 2010), and plenty of healthy people fall outside even that. Chasing a specific target number, especially one from a person of a different age or on a different device, is a recipe for anxiety and bad decisions. Your target is a stable-or-rising trend against your own baseline.
Misconception 2: "Low HRV means I am unhealthy"
Not on its own. A single low reading usually reflects last night's wine, a short sleep, a late meal, or ordinary stress. Even a genuinely low baseline for your age is a prompt to look at sleep, training load, alcohol, and stress, not a diagnosis. HRV is a trend metric and a nudge to investigate, not a verdict.
Misconception 3: "My HRV should keep climbing if I train hard"
Not necessarily. In heavy training blocks HRV can dip temporarily even as fitness improves, and extremely high HRV in heavily aerobically trained athletes can occasionally reflect the body overcorrecting. Within a sensible training range, a stable HRV that holds through a hard block is a good sign the body is absorbing the work.
What the Research Suggests Going Forward
HRV by age is a genuinely useful orientation tool and a genuinely misused one. The peer-reviewed norms and the published wearable datasets agree on the shape of the story: HRV is highest in early adulthood, falls fastest between the 20s and 40s, flattens later, and varies so much between individuals that the bands overlap across decades. That is why every credible source, from the academic reviews to the device makers themselves, lands on the same advice: compare yourself to yourself.
Limitations worth flagging:
- Wearable numbers are not clinical numbers. Consumer devices estimate HRV from optical sensors, not medical ECG. Even the most accurate track a trend well but should not be read as diagnostic values.
- Cross-device comparison is invalid. The Oura-versus-WHOOP gap is a measurement artifact, not a physiology difference. Do not mix devices and expect the numbers to line up.
- Population bands are broad by design. The "typical" ranges here describe roughly the middle half of people. Being outside them is common and not automatically a problem.
If you want the number to actually help you, stop asking "is this good?" and start asking "is this good for me, and which way is it trending?" That reframing turns HRV from a source of comparison anxiety into a quiet, useful signal about your own recovery.

References
- Nunan D, Sandercock GRH, Brodie DA. "A Quantitative Systematic Review of Normal Values for Short-Term Heart Rate Variability in Healthy Adults." Pacing and Clinical Electrophysiology. 2010;33(11):1407-1417. doi:10.1111/j.1540-8159.2010.02841.x
- Shaffer F, Ginsberg JP. "An Overview of Heart Rate Variability Metrics and Norms." Frontiers in Public Health. 2017;5:258. doi:10.3389/fpubh.2017.00258
- Umetani K, Singer DH, McCraty R, Atkinson M. "Twenty-Four Hour Time Domain Heart Rate Variability and Heart Rate: Relations to Age and Gender Over Nine Decades." Journal of the American College of Cardiology. 1998;31(3):593-601. doi:10.1016/S0735-1097(97)00554-8
- Dial MB, Hollander ME, Vatne EA, Emerson AM, Edwards NA, Hagen JA. "Validation of nocturnal resting heart rate and heart rate variability in consumer wearables." Physiological Reports. 2025;13(16):e70527. doi:10.14814/phy2.70527
Frequently Asked Questions
What is a good HRV for my age?
There is no single good HRV number, because HRV varies enormously between individuals. As a rough guide from published wearable data, typical overnight RMSSD ranges are around 55 to 105 ms in your 20s, 50 to 90 ms in your 30s, 40 to 75 ms in your 40s, 35 to 60 ms in your 50s, and 25 to 50 ms in your 60s. But healthy people fall well outside these bands. A quantitative review of 21,438 healthy adults (Nunan et al., 2010) put the average short-term RMSSD at about 42 ms with a normal range spanning 19 to 75 ms. The number that matters is your own baseline, not a population average.
Why does HRV decrease with age?
HRV falls with age because parasympathetic (vagal) control of the heart weakens as the autonomic nervous system ages. Umetani et al. (1998), which tracked 260 healthy people from age 10 to 99, found time-domain HRV measures like RMSSD declined steeply from the second to the sixth decade before leveling off. The decline is normal and expected, which is why a 60-year-old should never compare their number to a 25-year-old's. Regular aerobic and strength training can partially offset the age-related drop.
Is a higher HRV always better?
Within yourself, a higher HRV generally reflects better recovery and stronger vagal tone. Between people, higher is not automatically better, because HRV is shaped by age, genetics, body size, and measurement method. A 50-year-old with an RMSSD of 40 ms is not less healthy than a 25-year-old with 90 ms. The useful comparison is always you versus your own 30 to 60 day baseline, never you versus someone else.
Why is my HRV different on Oura versus WHOOP?
Because each device measures HRV at different times of night, over different windows, and reports it differently. Oura's published member average is about 41 ms, while WHOOP's published averages run higher (around 62 to 65 ms) because it emphasizes readings during slow-wave sleep. Dial et al. (2025) validated five wearables against ECG and found finger-ring sensors tracked the reference most closely. The practical rule: pick one device and track its trend. Absolute numbers are not comparable across brands.
How do I improve my HRV?
The biggest levers are sleep, aerobic fitness, alcohol, and stress. Consistent sleep, regular zone 2 aerobic training, limiting alcohol, and managing stress all tend to raise resting HRV over weeks. There is no quick fix, and a single good night will not move your baseline. Track the rolling 7-day average rather than any single morning, because day-to-day readings are dominated by short-term factors like last night's drink or a poor sleep.