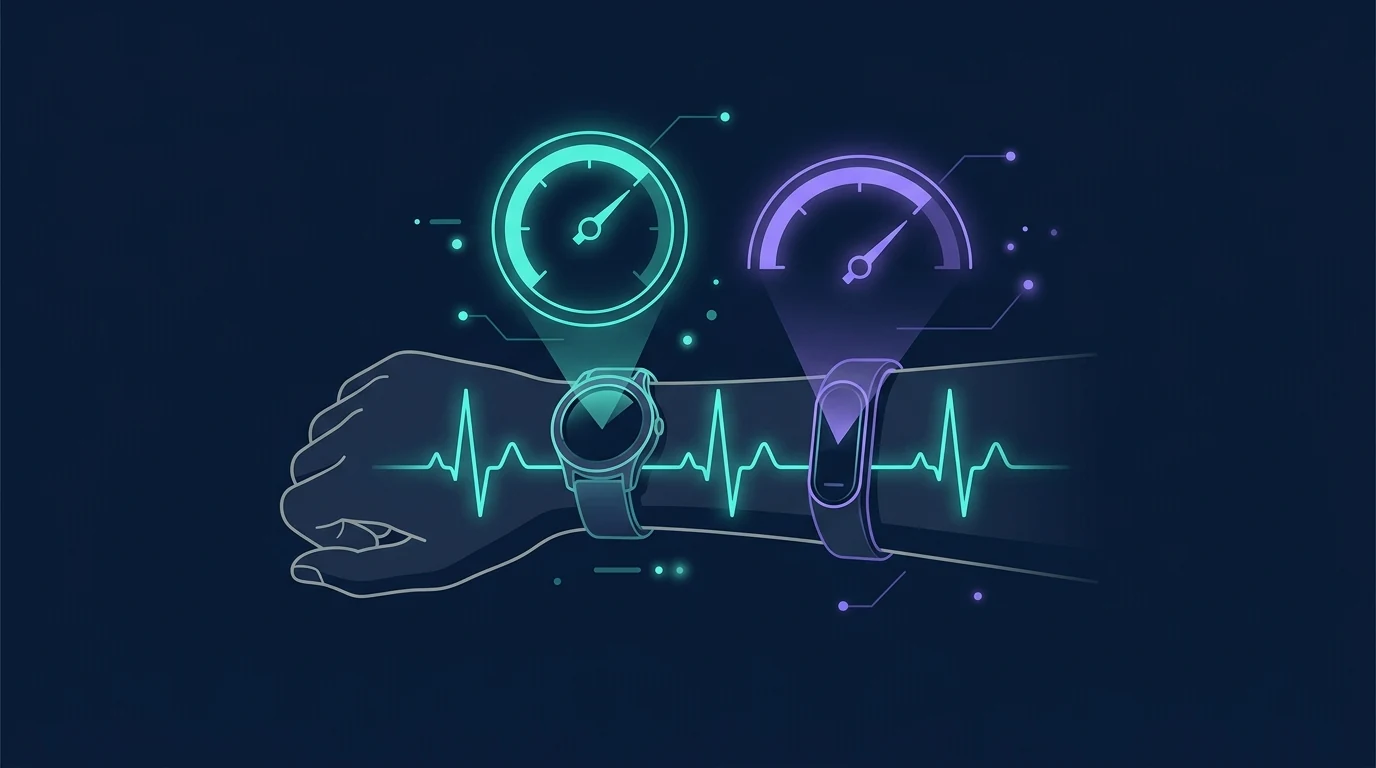
If you have ever worn two recovery trackers at once, you know the frustration. Your WHOOP clears you for a hard day at 78 percent recovered. Your Garmin's Body Battery says you are running on empty. Which one is right? The honest answer is that the question is slightly wrong. They are not two attempts to measure the same thing. They are two different opinions built from overlapping but differently processed data.
To understand why, you have to separate two layers that get blurred together in marketing: the raw physiological signal (your resting heart rate, your HRV) and the derived score (recovery, readiness, body battery). The first has a ground truth you can validate against a medical ECG. The second is a proprietary interpretation with no shared standard. This article walks through both layers, what the validation research shows for each, and what you should actually do about it.
For the foundation on what HRV is and how to read it, our heart rate variability training research and what is a good HRV by age pieces cover the underlying signal in depth.
Layer One: The Raw Signal Is Mostly Reliable
Start with the good news. The raw inputs that feed every recovery score, resting heart rate and HRV, are real physiological measurements with a clear reference standard: an electrocardiogram. And the better consumer devices measure them well.
The strongest recent evidence is Dial et al. (2025) in Physiological Reports, which had participants wear five devices (Oura Gen 3, Oura Gen 4, WHOOP 4.0, Garmin Fenix 6, Polar Grit X Pro) against a research-grade ECG across 536 nights of sleep. For overnight HRV (RMSSD):
- Oura Gen 4: concordance correlation 0.99, mean absolute percentage error about 6.0 percent.
- Oura Gen 3: concordance 0.97, error about 7.2 percent.
- WHOOP 4.0: concordance 0.94, error about 8.2 percent.
- Garmin Fenix 6: concordance 0.87, error about 10.5 percent.
- Polar Grit X Pro: concordance 0.82, error about 16.3 percent.
Resting heart rate was even more accurate across the board (errors mostly under 3 percent). So the finger-ring and better wrist devices are genuinely good at capturing the raw signal. There is a real hierarchy (rings beat watches for overnight HRV), but the top devices are close to ECG for the numbers that matter.
Wrist watches are the weaker link. O'Grady et al. (2024) in Sensors validated the Apple Watch Series 9 and Ultra 2 against a Polar H10 chest strap over 316 measurements and found the Apple Watch underestimated HRV by about 8.3 ms on average, with a mean absolute percentage error near 29 percent. That is accurate enough to follow your own multi-week trend but too coarse for fine day-to-day decisions. The sensor location and the optical measurement method matter a lot.
The key point: when two good devices measure your raw resting heart rate or HRV on the same night, they usually land close. The divergence you see in your apps is not mostly coming from this layer.
Layer Two: The Recovery Score Is a Black Box
Now the part that actually diverges. A "recovery score" is not a measurement. It is a computed verdict. Each brand takes a set of inputs and runs them through a proprietary model to output a single friendly number. The inputs overlap but the recipes do not:
- WHOOP Recovery is a 0 to 100 percent score weighted heavily toward HRV, plus resting heart rate, sleep, and respiratory rate, calibrated against your personal baseline.
- Oura Readiness is a 0 to 100 score that blends HRV, resting heart rate, body temperature, sleep, and the previous day's activity.
- Garmin Body Battery is a 0 to 100 "energy" estimate that updates continuously through the day, draining with stress and activity and recharging with rest, built on Firstbeat's stress and HRV models.
Three structural differences guarantee the scores will disagree:
1. Different inputs and weightings. A model that leans on body temperature (Oura) will flag an oncoming illness differently than one that does not. A model built around HRV (WHOOP) reacts to autonomic shifts more sharply than one built around continuous stress tracking (Garmin).
2. Different baselines. Each score compares today to your own history, but each brand builds that baseline over a different window and with different math. Two devices can even disagree on what "normal for you" is.
3. Different scales and update timing. A WHOOP recovery of 78 percent and a Body Battery of 78 are not the same claim, and one is a single morning snapshot while the other moves all day. There is no conversion between them because they were never on a shared scale.
None of the three major scores has transparent, independently published validation the way raw HRV does. They are competitive products, and the algorithms are trade secrets. That is not a scandal, but it does mean you should treat a recovery score as an informed opinion from one company's model, not as an objective readout of your body.

Derived Estimates Diverge Even More: The VO2max Example
Recovery scores are one kind of derived metric. VO2max is another, and it shows the same pattern in an even starker way, because here we can compare the wearable estimate to an actual laboratory gold standard.
Lambe et al. (2025) in PLOS ONE validated the Apple Watch (Series 9 and Ultra 2) against indirect calorimetry, the lab reference for VO2max. The watch underestimated VO2max by about 6.1 mL/kg/min on average, with a mean absolute percentage error of 13.3 percent. That is broadly consistent with the wider literature, where wrist-based VO2max estimates typically land within roughly 10 to 15 percent of a lab value, and where accuracy degrades in highly trained people whose true VO2max sits at the edge of the model's training data.
Garmin's Firstbeat-based estimate does better when paired with a chest strap (mean errors often in the 5 percent range under good conditions) and worse from the wrist alone. Same story as recovery: the derived number depends heavily on the sensor quality and the proprietary model, and two brands will hand you two different VO2max figures for the same lungs and heart.
The practical implication for any derived metric, whether it is VO2max, "training load," "fitness age," or a recovery percentage: the trend within one device is informative, the absolute number is approximate, and the cross-device comparison is meaningless. You can learn a lot from watching your own Apple Watch VO2max drift up over six months. You can learn nothing from noting that it reads three points lower than your friend's Garmin. Curious about the underlying metric? Our VO2 max glossary entry defines it, and the heart rate zone calculator helps you set training zones from a signal that does not depend on any proprietary score.
Get an evidence-based plan built for you
FitCraft, our mobile fitness app, pairs you with an AI coach who builds you a personalized plan around your goals, schedule, and fitness level. Every FitCraft program is designed by Domenic Angelino, MPH (Brown University) and NSCA-CSCS, with research published in the Journal of Strength and Conditioning Research and Medicine & Science in Sports & Exercise.
Take the Free Assessment Free • 2 minutes • No credit cardSleep Staging: Another Diverging Input
Since sleep feeds every recovery score, it is worth knowing that sleep staging also diverges by device. Schyvens et al. (2025) in Sleep Advances validated six wrist-worn devices against polysomnography, the clinical gold standard, in 62 participants. Every device was excellent at the simple sleep-versus-wake distinction (sensitivity above 90 percent), but staging accuracy (light, deep, REM) varied a lot: agreement with the reference (Cohen's kappa) ranged from about 0.21 for the weakest device to 0.53 for the best. Devices routinely mis-assigned wake time and disagreed on how much deep sleep you got.
So a recovery score that weights "deep sleep" is standing on a shaky input, and two devices will estimate your deep sleep differently. This compounds the divergence: not only do the algorithms differ, some of the ingredients they rely on are themselves noisy estimates rather than clean measurements.
What to Actually Do About It
None of this means recovery scores are useless. It means you should use them the way a good coach uses any single data point: as one input, read as a trend, sanity-checked against reality.
1. Pick one device and stay with it. The moment you compare across brands, the numbers stop meaning anything. Consistency within one device is what makes the trend readable.
2. Prefer devices with strong raw-signal accuracy. The recovery score sits on top of the raw HRV and heart rate. A device that measures those well (finger rings led in Dial et al., 2025) is building its verdict on firmer ground than one that measures them poorly.
3. Follow the rolling trend, not the daily number. A single low recovery score is dominated by last night's sleep, alcohol, or stress. A week or two of consistently low scores while training has not increased is the signal worth acting on.
4. Let your body break the tie. When the score and your lived experience strongly disagree, trust the tie-breakers the score cannot see: how the warm-up feels, your soreness, your mood, your motivation. If you feel great and the score says rest, a proper warm-up will tell you the truth quickly.
5. Do not let the score run your training. The research-supported use of recovery data is small adjustments over weeks (swap a hard day for easy when the trend is clearly down), not on-off switches every morning. For the full decision framework on training around a low reading, see HRV low today, should you still work out.
Common Misconceptions
Misconception 1: "The device with the higher recovery score is the accurate one"
Neither is objectively right, because there is no shared standard for what a recovery score should output. Both can be internally valid for tracking your own trend while being completely incomparable to each other. Accuracy applies to the raw HRV and heart rate, which you can validate. It does not cleanly apply to a proprietary composite score.
Misconception 2: "A low recovery score means I will have a bad workout"
Recovery scores predict readiness weakly at the individual-day level. Plenty of people post personal bests on "red" days and feel flat on "green" ones. The score reflects autonomic and sleep inputs, not your capacity to perform on a given day, which is why perceived readiness and a warm-up are better same-day predictors.
Misconception 3: "Wearable VO2max tells me my real fitness level"
It tells you an estimate within roughly 10 to 15 percent, and it can be off by more in trained athletes. Treat it as a trend line, not a lab result. If you need an accurate VO2max, a graded exercise test with gas analysis is the only real answer.
What the Research Suggests Going Forward
The wearable-recovery field is maturing, and the honest synthesis is a two-part story. The raw physiological signals (resting heart rate, HRV) are now measured well by the better devices, validated against ECG, with a clear accuracy hierarchy that favors finger rings for overnight HRV. That is a genuine achievement. The recovery scores stacked on top remain proprietary, unvalidated against each other, and built from different inputs, so their divergence is structural and will not go away.
Limitations worth flagging:
- Validation studies are small. Dial et al. used 13 participants over many nights; O'Grady et al. used 39. The device rankings are informative but not the final word, and firmware updates change accuracy over time.
- Recovery scores are moving targets. Brands update their algorithms, so a comparison from two years ago may not hold today.
- Individual response varies. Some people's performance tracks their recovery score closely; others show almost no relationship. Learn your own pattern before trusting any score's verdict.
The practical bottom line has not changed: the recovery score is a helpful nudge, not an oracle. Pick one device, watch the trend, and keep your own judgment in the loop. If your training keeps stalling because you feel constantly fatigued, the broader recovery picture in our overtraining syndrome research writeup is more useful than any single morning's number.
References
- Dial MB, Hollander ME, Vatne EA, Emerson AM, Edwards NA, Hagen JA. "Validation of nocturnal resting heart rate and heart rate variability in consumer wearables." Physiological Reports. 2025;13(16):e70527. doi:10.14814/phy2.70527
- O'Grady B, Lambe R, Baldwin M, Acheson T, Doherty C. "The Validity of Apple Watch Series 9 and Ultra 2 for Serial Measurements of Heart Rate Variability and Resting Heart Rate." Sensors. 2024;24(19):6220. doi:10.3390/s24196220
- Lambe R, O'Grady B, Baldwin M, Doherty C. "Investigating the accuracy of Apple Watch VO2 max measurements: A validation study." PLOS ONE. 2025;20(5):e0323741. doi:10.1371/journal.pone.0323741
- Schyvens AM, Peters B, Van Oost NC, et al. "A performance validation of six commercial wrist-worn wearable sleep-tracking devices for sleep stage scoring compared to polysomnography." Sleep Advances. 2025;6(2):zpaf021. doi:10.1093/sleepadvances/zpaf021
- Shaffer F, Ginsberg JP. "An Overview of Heart Rate Variability Metrics and Norms." Frontiers in Public Health. 2017;5:258. doi:10.3389/fpubh.2017.00258
Frequently Asked Questions
Why do my WHOOP and Garmin recovery scores disagree?
Because they are different proprietary algorithms measuring and weighting different things. WHOOP's Recovery percentage, Oura's Readiness, and Garmin's Body Battery all draw on heart rate, HRV, and sleep, but each combines those inputs differently, references a different personal baseline, and updates on a different schedule (Body Battery runs continuously, WHOOP and Oura produce a single morning score). A Body Battery of 42 and a WHOOP recovery of 78 percent on the same morning is expected. The scores are not on a common scale and were never meant to match.
Are the raw numbers reliable even if the scores are not?
Generally yes. Dial et al. (2025) validated five wearables against ECG across 536 nights and found resting heart rate and HRV were measured well by the better devices, with Oura rings closest to the reference (concordance around 0.97 to 0.99 for HRV) and WHOOP acceptable. Raw resting heart rate and HRV are physiological measurements with a ground truth. The recovery score is an interpretation layered on top, and interpretations differ by brand.
How accurate is wearable VO2max?
It is a ballpark, not a lab value. A 2025 validation of the Apple Watch (Lambe et al.) found a mean absolute percentage error of 13.3 percent versus a laboratory test, underestimating VO2max by about 6 mL/kg/min on average. Wrist-based estimates are typically off by roughly 10 to 15 percent, and accuracy is worse in highly trained individuals. Wearable VO2max is fine for tracking your own trend over months but should not be treated as a precise fitness number or compared across brands.
Which device has the most accurate recovery tracking?
For the raw inputs that feed recovery, finger-ring sensors (Oura) validated best for overnight HRV and resting heart rate in Dial et al. (2025), with WHOOP close behind and wrist watches less consistent. But no independent study has crowned any brand's overall recovery score as most accurate, because the scores are proprietary and lack transparent, published validation. The most trustworthy approach is to pick one device with good raw-signal accuracy and follow its trend rather than its daily verdict.
Should I trust my recovery score or how I feel?
Use both, and weight the trend over the daily flag. A recovery score is one noisy input, best read as a rolling trend rather than a single morning's verdict. Your own perceived readiness, sleep quality, soreness, and how a warm-up feels are equally valid signals. If the score and your body strongly disagree, your body usually wins. The score is a prompt to check in, not a command.