- It is redistribution, and it has been measured. In 380 women scanned by DXA across the menopause transition, android fat accelerated from 1.21 percent per year to 5.54 percent per year, and visceral fat rose 6.24 percent per year.
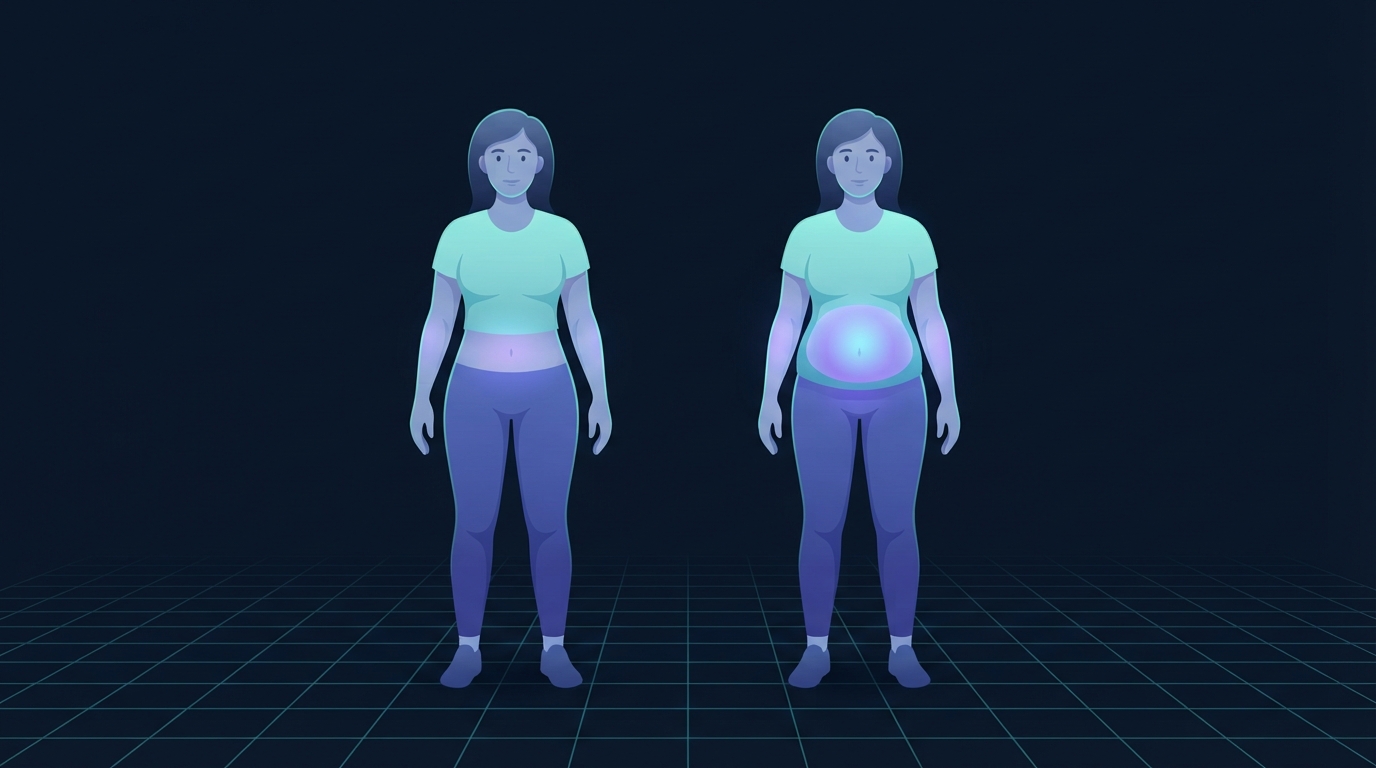
- The scale hides it. In the same cohort, body weight climbed in a straight line through premenopause with no acceleration at the transition and then flattened. The fat gain doubled while the weight curve stayed calm.
- The window is about 3.5 years. The accelerated phase starts roughly two years before the final menstrual period and decelerates about 1.5 years after it. Roughly 1.6 kg of fat and 0.2 kg of lean mass change hands in that span.
- It is not cosmetic. In the SWAN Heart study, every 20 percent increase in visceral fat across the transition came with a 2 percent thicker carotid artery lining, independent of weight and BMI.
- Training works on it, and the two modes do different jobs. Across 101 trials in 5,697 postmenopausal women, exercise cut body fat 1.86 percentage points and waist circumference 1.45 cm while adding 0.66 kg of lean mass. Aerobic work moved the fat; resistance work moved the muscle.
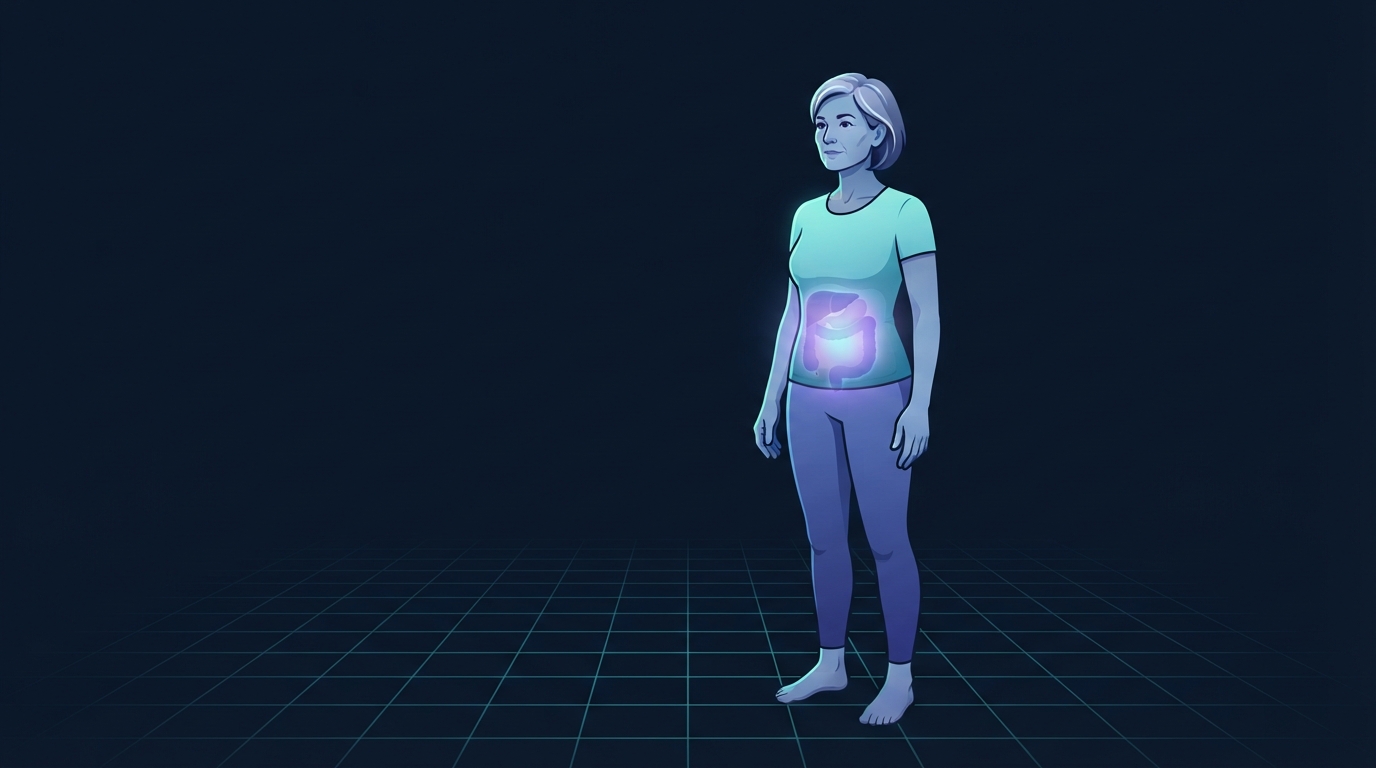
Somewhere in your late forties, the same body started behaving differently. Nothing about your eating or training obviously changed, your weight moved a pound or two at most, and yet your waistband tells a completely different story than it did three years ago. Almost every woman who describes this assumes she is either imagining it or failing at something.
Neither. What you are describing has been tracked with DXA and CT imaging in thousands of women across the menopause transition, and the imaging says something that the bathroom scale physically cannot: the fat did not mostly arrive, it mostly moved. Understanding which depot it moved into, and when, changes what is worth doing about it.
This article works through four longitudinal datasets that define the phenomenon, the reason your weight can stay flat while your shape does not, how this differs from the cortisol story that gets attached to every midsection change, and what the intervention trials in postmenopausal women actually produced.
What "Menopause Belly" Actually Is
Menopause belly is not a diagnosis. There is no ICD code for it and no threshold that makes it official. What it describes is real and specific: a shift in fat distribution toward the abdomen that is timed to the menopause transition rather than to age, and that lands disproportionately in the visceral compartment.
That compartment distinction is the whole article. Subcutaneous abdominal fat sits under the skin and is what you can pinch. Visceral fat sits deeper, packed between and around the organs, and is the depot with the strongest links to insulin resistance, lipid changes and cardiovascular risk. Both increase in midlife. Only one of them accelerates because of menopause specifically.
One more thing it is not: bloating. Bloating comes and goes over hours, changes with meals, and responds to fibre, salt and gut factors. The change described here took two to four years to appear and does not resolve overnight. If your midsection fluctuates day to day, that is a different problem with a different fix.
The Research: What Studies Show
Greendale et al. (2019): the fat gain rate doubles, and the scale misses it
The foundational dataset is the Study of Women's Health Across the Nation. Greendale et al. (2019) in JCI Insight followed 1,246 women through the transition with repeated DXA scans, with a mean baseline age of 47.1 and a mean age at final menstrual period of 52.2.
Before the transition, fat mass rose about 1.0 percent per year, roughly 0.25 kg annually. During the transition that rate doubled to 1.7 percent per year, about 0.45 kg annually, and it stayed elevated for a defined window: beginning roughly two years before the final menstrual period and decelerating about 1.5 years after it, for a total of about 3.5 years. Across that window women gained around 1.6 kg of fat. Lean mass, which had been rising before the transition, started falling at 0.2 percent per year.
Then the finding that explains the confusion. Body weight climbed linearly through premenopause with no acceleration at the transition, and the weight curve flattened afterwards. Weight and body composition came apart. A woman gaining fat and losing lean mass at the same time can hold a stable number on the scale for years while her body genuinely changes underneath it.
Greendale et al. (2021): where it went, and why your tape measure missed it
A companion analysis, Greendale et al. (2021) in the Journal of Clinical Endocrinology and Metabolism, looked at regional distribution in 380 women with DXA-derived android and visceral fat estimates.
| Measure | Premenopause | Menopause transition | Postmenopause |
|---|---|---|---|
| Android fat | 1.21% per year | 5.54% per year | 0.90% per year |
| Visceral fat | No significant rise | 6.24% per year | 1.47% per year |
| Waist circumference | 0.55% per year | 0.96% per year | 0.55% per year |
Android and visceral fat accelerated roughly fivefold during the transition and then slowed sharply. Waist circumference crept up at rates that were not statistically different across the three phases. The authors' conclusion is worth carrying: the transition is associated with the development of central adiposity, and tape-measure anthropometry is a poor instrument for detecting it. If you have been tracking your waist and concluding nothing much is happening, the measurement is the problem.
Lovejoy et al. (2008): menopause, not age, drives the visceral part
The cleanest separation of menopause from aging comes from Lovejoy et al. (2008) in the International Journal of Obesity, a four-year longitudinal study of 156 initially premenopausal women, 51 of whom became postmenopausal during follow-up. Fat was measured by DXA, abdominal depots by CT, and energy expenditure in a whole-room calorimeter.
Every woman gained subcutaneous abdominal fat with age. Only the women who became postmenopausal showed a significant increase in visceral fat. That is the natural experiment: same four years, same aging, and the visceral change tracked the hormonal transition rather than the birthdays.
Two energy findings sit underneath that. Sleeping energy expenditure fell in everyone, but the decline was 1.5 times larger in the women who became postmenopausal (7.9 percent versus 5.3 percent). And fat oxidation fell 32 percent in the postmenopausal group while not changing at all in the women who stayed premenopausal. Less energy burned at rest, and a shift toward storing rather than oxidising fat, at the same time as the redistribution.
Samargandy et al. (2021): the part that is not about appearance
Samargandy et al. (2021) in Menopause reported the SWAN Heart study, which put CT-measured visceral fat and carotid ultrasound together in 362 women with a mean age around 51.
Visceral fat rose 8.2 percent per year (95% CI 4.1 to 12.5) in the two years before the final menstrual period and 5.8 percent per year (3.7 to 7.9) afterwards, with no significant change earlier than two years before. And every 20 percent increase in visceral fat was associated with a 2 percent thicker carotid intima-media lining, independent of overall weight, BMI and traditional cardiovascular risk factors.
That is the reason this belongs in a health article rather than a styling one. The thing accumulating is the depot most strongly tied to arterial change, and the association survived adjustment for the numbers most women are actually tracking.
Why the Scale Stays Flat While Your Waistband Does Not
Put the four datasets together and the mechanism is not mysterious. Fat mass rises about 0.45 kg a year during the transition while lean mass falls about 0.06 kg a year. Net weight change is small. Volume change is not, because fat occupies substantially more space per kilogram than muscle does, and because the fat is arriving in one region rather than spreading evenly.
The energy side compounds it. Losing lean mass lowers resting energy expenditure, and Lovejoy and colleagues measured an additional menopause-specific drop in sleeping energy expenditure on top of the age-related one. Eating exactly as you did at 45 therefore produces a small daily surplus at 52 without any change in behaviour. Small surpluses maintained for three years are precisely how 1.6 kg of fat arrives unnoticed.
The practical consequence is that weight is the wrong instrument here, and so is a tape measure, per Greendale 2021. Better markers are how clothes fit at the waist, what you can lift, and the metabolic panel your clinician already runs. If you want one number to watch, strength on a couple of lifts tracks the lean mass side better than anything a bathroom scale reports.
Menopause Belly vs Cortisol Belly
These two labels get used for the same midsection, and the evidence behind them is not remotely comparable.
Menopause belly has a measured trigger, a measured timeline and a measured depot. Cortisol belly is a folk category with no clinical definition and no diagnostic test, and the association it rests on is very small: long-term hair cortisol correlates with waist circumference at around r equals 0.08, which explains well under 1 percent of the variance. Chronic active stress does raise long-term cortisol, and stress does influence eating and sleep, so it is a genuine contributor. It is not the mechanism. We went through that literature in detail in our review of what the research actually says about cortisol belly.
Why the distinction matters practically: the cortisol framing sends people toward adaptogens, cortisol-blocking supplements and breathwork protocols as the primary intervention. None of those has evidence of reducing abdominal fat in people without endocrine disease. The menopause framing sends you toward resistance training, protein and aerobic work, which is where the trial evidence actually is. If you are in your late forties or fifties and the change took years rather than weeks, you are in the second story.
Get an evidence-based plan built for you
FitCraft, our mobile fitness app, pairs you with an AI coach who builds you a personalized plan around your goals, schedule, and fitness level. Every FitCraft program is designed by Domenic Angelino, MPH (Brown University) and NSCA-CSCS, with research published in the Journal of Strength and Conditioning Research and Medicine & Science in Sports & Exercise.
Take the Free Assessment Free • 2 minutes • No credit cardWhat the Evidence Says Actually Moves It
Exercise training, in this population specifically
The relevant synthesis is Khalafi et al. (2023) in Frontiers in Endocrinology, which pooled 101 randomized controlled trials covering 5,697 postmenopausal women. It is the right evidence base for this question because it excludes younger women whose hormonal environment is different.
- Body fat percentage: down 1.86 points (95% CI 2.42 to 1.29 lower).
- Fat mass: down 1.27 kg.
- Waist circumference: down 1.45 cm.
- Visceral fat: reduced, standardised mean difference 0.38 lower (0.62 to 0.14).
- Lean mass: up 0.66 kg.
The modality split is the useful part. Aerobic training drove the fat outcomes, producing the largest reductions in fat mass (1.94 kg) and waist circumference (2.30 cm). Resistance training drove the lean mass gain (0.90 kg), with combined training close behind at 0.68 kg. Neither replaces the other, and the transition is removing lean mass at the same time it is adding visceral fat, so a plan that only does cardio leaves half the problem untouched. Our week-by-week strength training plan for after menopause is built around that split.
Does intensity matter?
Dupuit et al. (2020) in Experimental Physiology meta-analysed high intensity interval training in women before and after menopause. Interval work did significantly reduce body weight and total and abdominal fat mass, but the effects were clearly more pronounced in premenopausal than postmenopausal women. Within the postmenopausal group, cycling-based intervals outperformed running-based ones, and programmes needed to run longer than eight weeks at three sessions a week to show much.
Read that as permission rather than a prescription. Intervals are not a required ingredient, they do less after menopause than before, and if joints or recovery make them unappealing, the aerobic effects in Khalafi's pooled analysis did not depend on them. Sustainable frequency beats intensity here.
Protein, and defending the lean mass
The lean mass line in Greendale 2019 is small in kilograms and large in consequence, because muscle is what sets resting energy expenditure and what keeps the age-related slide toward sarcopenia from starting early. Resistance training supplies the signal. Protein supplies the material, and appetite and habit rarely adjust upward on their own during this window.
The practical target most guidance lands on is roughly 1.6 g of protein per kg of body weight per day for women doing resistance training, spread across meals rather than concentrated at dinner. That is meaningfully more than most women in their fifties are eating, and it is the single dietary change with the clearest mechanism behind it here.
What about hormone therapy?
The OsteoLaus cohort, reported by Papadakis et al. (2018) in the Journal of Clinical Endocrinology and Metabolism, found that women using menopausal hormone therapy had significantly lower visceral abdominal fat, android fat mass and body mass index than non-users.
Two honest caveats. This is a cross-sectional association in a cohort, not a randomized trial, so it cannot exclude the possibility that women who use hormone therapy differ in other ways that also affect body composition. And hormone therapy is prescribed for symptoms and for bone protection, not as a body composition treatment. It is a conversation to have with your clinician about symptoms, with this as context rather than as the reason.
Common Misconceptions
Misconception 1: "It is bloating, not fat"
Bloating is real and common in perimenopause, and it is a different phenomenon on a different timescale. Bloating varies within a single day, responds to meals, fibre and salt, and resolves. What the imaging studies describe accumulates over two to four years and is measurable on a CT scan. Both can be true at once, and the distinguishing question is simple: does your midsection look different in the morning than at night, or does it look different than it did three years ago? The first is bloating. The second is the redistribution.
Misconception 2: "Core work will target it"
Abdominal training builds the muscle underneath the fat, which is worth doing for trunk strength and back health. It does not preferentially burn the fat sitting above and around it, and visceral fat in particular is not adjacent to the muscles a crunch trains. Whole-body aerobic and resistance work is what moved visceral fat in the postmenopausal trials. We covered the underlying reasoning in our guide to the best exercises to lose belly fat, which is worth reading for the spot-reduction evidence rather than repeating here.
Misconception 3: "It is just aging, menopause has nothing to do with it"
Partly true, and the Lovejoy design is what separates the two. Subcutaneous abdominal fat increased with age in every woman in that study, postmenopausal or not. Visceral fat increased significantly only in the women who crossed into postmenopause during the same four years. Age explains part of the midsection change. The visceral acceleration, the doubling of the fat gain rate and the 3.5 year window around the final period are menopause-specific, and they are the part this article is about.
What the Research Suggests Going Forward
The descriptive picture here is unusually strong for a topic this crowded with marketing. Multiple longitudinal cohorts using DXA and CT converge on the same story: a defined window, a specific depot, a decoupling of weight from composition, and a cardiovascular association that survives adjustment. That is more than most midlife body composition claims can offer.
The intervention picture is a step behind. Khalafi's pooled trials are in postmenopausal women, which is the right population, but very few trials have enrolled women during the transition itself, when the acceleration is actually happening and when preventing accumulation should be easier than reversing it. Visceral fat was also the least-measured outcome in that analysis, appearing in only 11 intervention arms. So the strongest claim the evidence supports is that exercise training improves body composition and reduces visceral fat in this population, not that any specific protocol is optimal for the transition window.
What to do with that is not complicated. Start before or during the window rather than after it. Lift two or three times a week and keep aerobic work in the schedule, because they produce different halves of the result. Eat more protein than feels necessary. Judge progress by strength, clothing fit and your metabolic panel rather than by body weight, because the whole point of the SWAN finding is that weight is the number least able to see this. If you would rather have a plan handle the structure, we compared the best fitness apps for women against exactly these criteria.
References
- Greendale GA, Sternfeld B, Huang M, et al. "Changes in body composition and weight during the menopause transition." JCI Insight 4.5 (2019): e124865. DOI: 10.1172/jci.insight.124865
- Greendale GA, Han W, Finkelstein JS, et al. "Changes in regional fat distribution and anthropometric measures across the menopause transition." Journal of Clinical Endocrinology and Metabolism 106.9 (2021): 2520-2534. PMID: 34061966
- Samargandy S, Matthews KA, Brooks MM, et al. "Abdominal visceral adipose tissue over the menopause transition and carotid atherosclerosis: the SWAN heart study." Menopause 28.6 (2021): 626-633. DOI: 10.1097/GME.0000000000001755
- Lovejoy JC, Champagne CM, de Jonge L, Xie H, Smith SR. "Increased visceral fat and decreased energy expenditure during the menopausal transition." International Journal of Obesity 32.6 (2008): 949-958. PMID: 18332882
- Khalafi M, Habibi Maleki A, Sakhaei MH, et al. "The effects of exercise training on body composition in postmenopausal women: a systematic review and meta-analysis." Frontiers in Endocrinology 14 (2023): 1183765. DOI: 10.3389/fendo.2023.1183765
- Dupuit M, Maillard F, Pereira B, et al. "Effect of high intensity interval training on body composition in women before and after menopause: a meta-analysis." Experimental Physiology 105.9 (2020): 1470-1490. DOI: 10.1113/EP088654
- Papadakis GE, Hans D, Gonzalez Rodriguez E, et al. "Menopausal hormone therapy is associated with reduced total and visceral adiposity: the OsteoLaus cohort." Journal of Clinical Endocrinology and Metabolism 103.5 (2018): 1948-1957. DOI: 10.1210/jc.2017-02449
Frequently Asked Questions
What is menopause belly?
Menopause belly is the everyday name for a measured shift in where the body stores fat during the menopause transition, toward the abdomen and specifically toward the deep visceral depot around the organs. It is not a clinical diagnosis, but the underlying change is well documented. In the SWAN cohort, android fat accelerated from 1.21 percent per year before the transition to 5.54 percent per year during it, and visceral fat rose 6.24 percent per year, then both decelerated afterwards (Greendale et al., 2021). Total body weight, meanwhile, climbed in a straight line through the same period with no acceleration at all, which is why so many women report that their shape changed while the scale barely moved.
Is menopause belly the same as cortisol belly?
No. They point at similar-looking midsections through very different evidence. Menopause belly describes a redistribution timed to the final menstrual period, measured by DXA and CT in longitudinal cohorts, with a known hormonal trigger and a clear 3.5 year window. Cortisol belly is a popular label with no clinical definition and correlations so small that long-term cortisol explains well under 1 percent of the variance in waist circumference. If you are in your late forties or fifties and your midsection changed over two to four years, the menopause literature is the better explanation, and stress is a contributor rather than the mechanism.
How do you get rid of menopause belly?
The evidence supports training the whole body rather than the abdomen. A meta-analysis of 101 randomized trials in 5,697 postmenopausal women found exercise training cut body fat by 1.86 percentage points, fat mass by 1.27 kg and waist circumference by 1.45 cm, and reduced visceral fat directly, while adding 0.66 kg of lean mass (Khalafi et al., 2023). Aerobic work drove the fat and waist changes, resistance training drove the lean mass. Doing both is the practical answer, alongside enough protein to defend the muscle the transition is quietly removing. Abdominal exercises build the muscle underneath but do not preferentially burn the fat above it.
Does menopause belly go away on its own?
The accelerated phase stops on its own, but the fat it deposited does not leave on its own. SWAN data show fat gain decelerating to roughly zero slope after the transition, and android and visceral fat accumulation slowing to about 0.90 and 1.47 percent per year postmenopause. So the steep part is a window of roughly 3.5 years, starting about two years before the final period. What that means practically is that acting during or soon after the transition prevents more accumulation than it has to reverse, and that waiting it out leaves the deposit in place.
Does hormone therapy reduce menopause belly?
The observational evidence points that way, and it is not a weight-loss treatment. In the OsteoLaus cohort, women using menopausal hormone therapy had significantly lower visceral abdominal fat, android fat mass and body mass index than non-users (Papadakis et al., 2018). That is a cross-sectional association rather than a randomized result, so it cannot rule out the possibility that women who choose hormone therapy differ in other ways. Hormone therapy is prescribed for symptoms and bone health, and any decision about it belongs with your clinician rather than with a body composition goal.