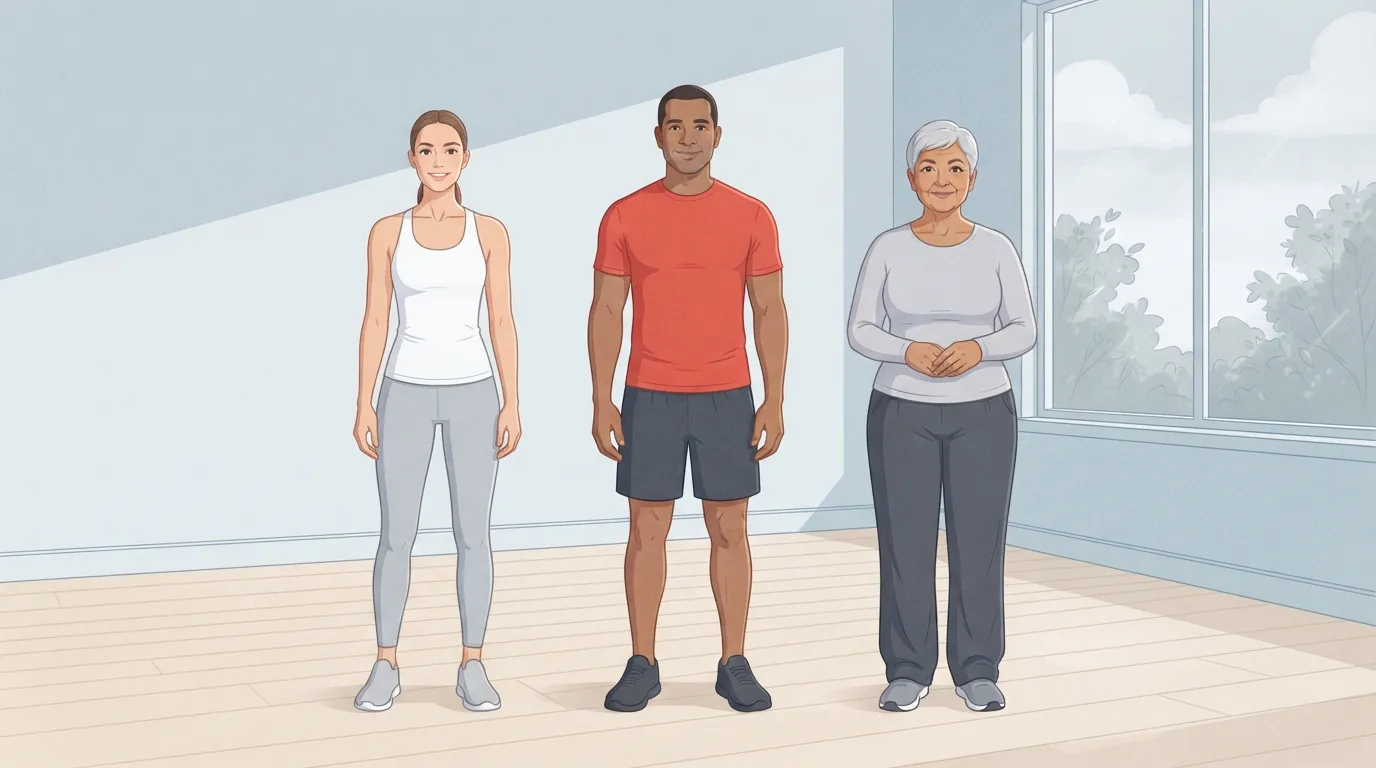
A familiar post in fitness forums goes like this: someone at about 15 percent body fat says they feel good, but keeping it there takes more effort than they want to spend, so is it actually necessary to be healthy? The replies range from "you're already lean" to "aim for 10," and almost none of them cite anything.
That gap is the problem. Smart scales throw a different number at you every morning, social media treats single-digit body fat as normal, and the charts online disagree with each other by several points. It's easy to feel like you're failing at a target nobody has clearly defined.
So here's what's actually known. Below you'll find the healthy ranges by age and sex from the study most charts are built on, the American Council on Exercise chart, what those numbers are based on, how each measuring method performs, how low is too low, and what it takes to move into a healthy range.
Healthy Body Fat Percentage by Age and Sex
The most cited healthy ranges come from Gallagher and colleagues (2000) in the American Journal of Clinical Nutrition. The team measured body fat in 1,626 adults at Cambridge in the UK, Columbia in New York and Jikei in Tokyo, using a 4-compartment model and DXA scans, two of the most accurate reference methods available. They then worked out what body fat percentage lines up with the standard BMI cut-offs: under 18.5 for underweight, 25 for overweight and 30 for obesity.
Here are their ranges for white and African American adults, centered on the ages of 30, 50 and 70.
| Age | Sex | Below healthy | Healthy | Overweight range | Obese range |
|---|---|---|---|---|---|
| 20 to 39 | Men | Under 8% | 8% to under 20% | 20% to under 25% | 25% or more |
| 40 to 59 | Men | Under 11% | 11% to under 22% | 22% to under 28% | 28% or more |
| 60 to 79 | Men | Under 13% | 13% to under 25% | 25% to under 30% | 30% or more |
| 20 to 39 | Women | Under 21% | 21% to under 33% | 33% to under 39% | 39% or more |
| 40 to 59 | Women | Under 23% | 23% to under 34% | 34% to under 40% | 40% or more |
| 60 to 79 | Women | Under 24% | 24% to under 36% | 36% to under 42% | 42% or more |
Source: Gallagher and colleagues (2000), Table 4, based on 4-compartment estimates. "Below healthy" corresponds to a BMI under 18.5.
Two patterns stand out. Women's healthy range sits about 11 to 13 points higher than men's at every age, which is normal biology rather than a lower standard. And both ranges climb with age, because at the same BMI, older adults carry a higher share of their weight as fat.
Ethnicity matters too. Asian participants, all measured in Japan, carried more fat at the same BMI, so the paper gave them a separate table: for adults aged 20 to 39, the healthy band ran from about 13 to under 23 percent for men and 25 to under 35 percent for women.
The ACE Body Fat Percentage Chart
The other chart you'll see everywhere comes from the American Council on Exercise (ACE), which published its percent body fat norms for men and women alongside its body fat calculator. It doesn't vary by age, and it adds categories for essential fat, athletes and fitness.
| ACE category | Women | Men |
|---|---|---|
| Essential fat | 10% to 13% | 2% to 5% |
| Athletes | 14% to 20% | 6% to 13% |
| Fitness | 21% to 24% | 14% to 17% |
| Acceptable | 25% to 31% | 18% to 24% |
| Obesity | 32% or more | 25% or more |
For women, the two charts mostly agree. ACE's fitness and acceptable bands, 21 to 31 percent, sit inside Gallagher's healthy range for women under 40, and the only clash is at the top, where Gallagher's healthy band runs to 33 percent and ACE starts obesity at 32. For men, they differ more. ACE calls 18 to 24 percent acceptable, while Gallagher's table puts 20 percent and above in the overweight range for men under 40. Both start obesity for young men at 25 percent.
What the Ranges Are Based On
This is the part most body fat charts leave out. Neither table was built by following people with different body fat levels to see who stayed healthy.
Gallagher's team said so directly. In their discussion, they wrote that "the information needed to directly associate percentage body fat with morbidity and mortality is, unfortunately, presently unavailable." Their ranges translate BMI guidelines into body fat. They're a reasonable bridge, built on accurate measurements, but they inherit BMI's assumptions. They also excluded anyone in a vigorous training program of more than six hours a week, so the table describes typical adults, not athletes. ACE presents its chart as norms and doesn't attach an outcome study to it.
Two other data points help put the charts in context.
- Average isn't the same as healthy. Li and colleagues (2009) analysed DXA scans from 13,066 US adults in the national NHANES survey and found an average body fat of 28.1 percent in men and 40.0 percent in women. Both averages sit above the healthy ranges in either chart.
- Outcome data back the direction of the charts. Padwal and colleagues (2016) followed 54,420 Canadian adults aged 40 and older who'd had a DXA scan as part of bone density testing. With BMI and body fat percentage in the same model, the highest fifth of body fat was linked with a 19 percent higher risk of death in women and 59 percent higher in men. A low BMI was also linked with higher mortality, which is a reminder that too little body mass carries its own risk.
Read the charts as guide rails. Being a point or two outside a band doesn't change your health overnight, and your waist size, blood pressure, blood sugar, fitness and strength all matter alongside the number. If you want a measure of where your fat sits rather than how much you carry, our guide to the waist to hip ratio covers the tape measurement that captures it.
Knowing what to do is the easy part.
FitCraft, our mobile fitness app, pairs you with an AI coach who builds you a personalized plan around your goals, schedule, and fitness level. Every FitCraft program is designed by Domenic Angelino, MPH (Brown University) and NSCA-CSCS, with research published in the Journal of Strength and Conditioning Research and Medicine & Science in Sports & Exercise.
Take the Free Assessment Free • 2 minutes • No credit card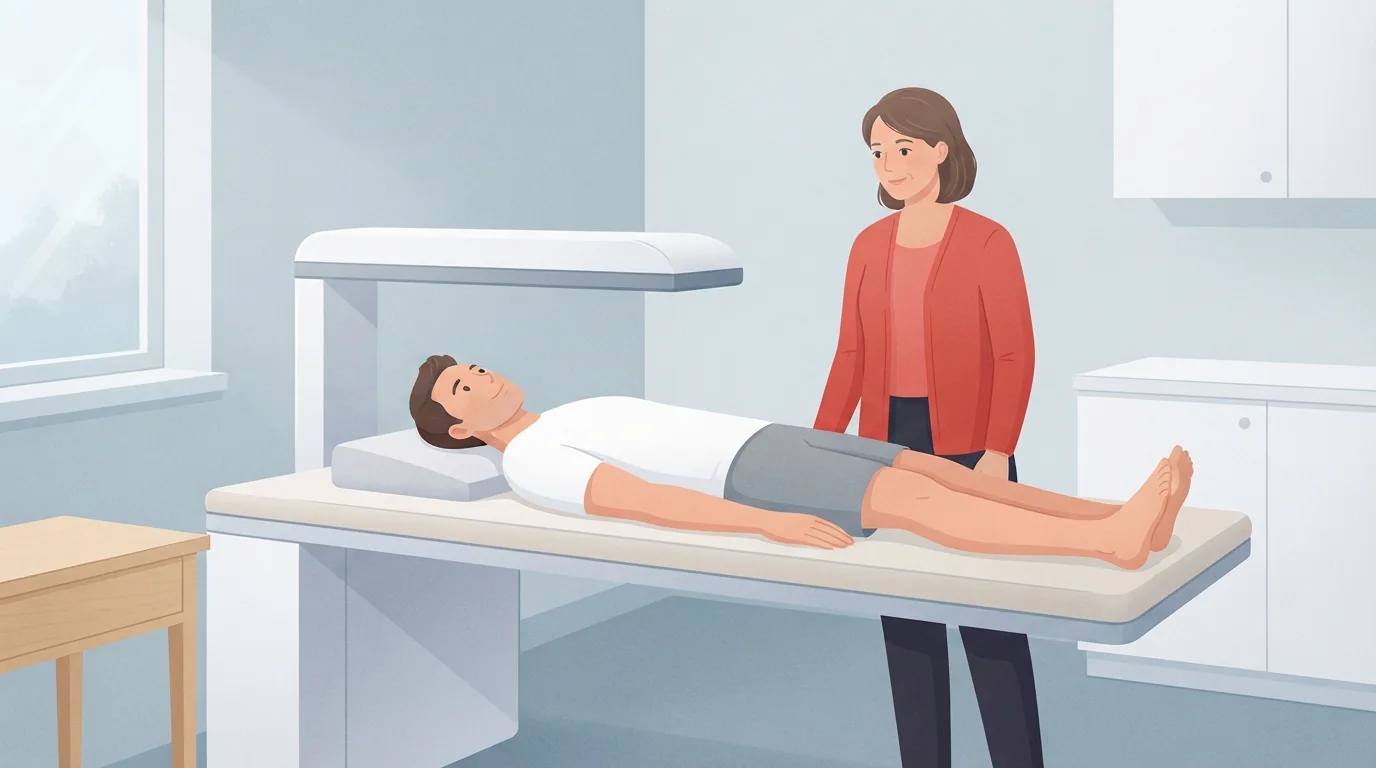
How to Measure Body Fat Percentage
Body fat percentage is your fat mass divided by your total weight, times 100. Nobody can weigh their fat directly, so every method estimates it, and each one carries its own error. Here's how the common options compare.
| Method | What it needs | How far off it can be | Best use |
|---|---|---|---|
| DXA scan | A clinic or lab visit | Repeat scans within about 1%; small bias against lab reference models | A baseline you can trust, retested on the same machine |
| Bioimpedance (BIA) scales and handhelds | A device at home | Device averages ranged from 3.5 points too low to 11.7 points too high | Tracking change under identical conditions |
| Skinfold calipers | Calipers and a trained tester | About 3 to 4 points when done well | Tracking change with the same tester |
| Tape formula (US Navy method) | A tape, your height | Several points; among the least accurate in one recent test | A free starting estimate and trend |
DXA
Dual-energy X-ray absorptiometry uses low-dose X-rays at two energies to sort your body into fat, lean tissue and bone. It's the reference most of the studies above relied on. Hind and colleagues (2011) scanned 52 adults twice in a row, repositioning them in between, and found a precision error of just 0.86 percent for body fat percentage. That's precision, meaning the scan repeats itself well. Accuracy is a separate question: Gallagher's team found a small but real gap between DXA and their 4-compartment reference, and different machines and software versions can disagree. Retest on the same machine.
Bioimpedance scales
Smart scales and handheld analyzers send a small electrical current through your body and estimate fat from how easily it passes. Siedler and colleagues (2023) tested 15 of these devices, 14 of them consumer models, against a 4-compartment model in 73 healthy adults. The devices were very consistent, with repeat readings almost identical. They weren't all accurate: average errors ranged from 3.5 percentage points too low to 11.7 points too high, depending on the device. Tracking change was better. When 37 people came back 12 to 16 weeks later, the devices followed their real change with standard errors of about 1.7 to 2.6 points, and the authors singled out eight-electrode hand-and-foot models and some foot-only scales as useful for tracking. Because the current travels through water, weigh in at the same time of day, before eating or training.
Skinfold calipers
Calipers measure the thickness of pinched skin and fat at several sites, and an equation converts the total into body fat. The standard equations come from Jackson and Pollock (1978), built on 308 men aged 18 to 61 and checked in a second group of 95. Their predictions correlated above 0.90 with laboratory body density, and ACE's own guidance puts the error at about 3.5 percentage points. That assumes a practiced tester, and the same tester every time.
The US Navy tape formula
The Navy method estimates body fat from your height and the circumference of your neck and waist, plus your hips if you're a woman. It's free and quick, and our body fat calculator runs it with an honest error range. Just know its limits. In a 2026 test on 57 Air Force ROTC cadets, Graybeal and colleagues found that tape-based circumference equations produced the largest errors of any method compared with DXA. The same study found 57.9 percent of cadets met the BMI standard but only 33.3 percent met the DXA body fat standard.
The practical rule for all four is the same. Pick one method, use it under the same conditions, and judge the trend over months. A single reading tells you roughly where you are. Five readings in a row tell you which way you're heading.
How to Move Into a Healthy Range
Your body fat percentage can drop two ways: by losing fat, and by adding muscle. The best plans do both at once, which is called body recomposition, and it's realistic for beginners and anyone returning after a break. Our post on body recomposition at home walks through the evidence and a full home protocol. These are the essentials.
- Lift two or three times a week. Dumbbells and bodyweight are enough: squats, lunges, Romanian deadlifts, push-ups, rows and overhead presses, adding reps or weight as they get easier.
- Eat in a small deficit if you have fat to lose. A steady, modest gap protects muscle better than a crash diet. If you're already in the healthy range, eating at maintenance while you train is enough to keep improving your body composition.
- Get protein at every meal. It's the nutrient most tied to keeping muscle while fat comes off.
- Walk most days. Daily walking adds to the energy you burn without leaving you too tired to lift.
- Measure once a month. Same method, same conditions. Add a waist measurement, because it often moves when the scale doesn't.
If you'd like an app to structure the strength side, our comparison of the best strength training apps sets the options side by side. FitCraft's programs are built on dumbbell and bodyweight strength work, with a 3D AI coach who demonstrates each exercise, plus streaks and leaderboards that make the next session easier to show up for.
Essential Fat: How Low Is Too Low?
Essential fat is the fat your body needs to work normally: in your nerves, bone marrow, organs and cell membranes. ACE puts it at 2 to 5 percent for men and 10 to 13 percent for women. Women's essential fat is higher because it includes sex-specific stores tied to reproductive and hormonal function, so a woman at 12 percent is closer to her floor than a man at 5.
Getting near that floor usually means eating too little for the training you do, and the body responds by turning systems down. The International Olympic Committee's consensus on Relative Energy Deficiency in Sport (Mountjoy and colleagues, 2023) describes the effects of low energy availability on hormones, bone, mood and performance, and includes guidance on assessing body composition safely in athletes.
A detailed case study shows what that looks like in practice. Rossow and colleagues (2013) tracked a drug-free male bodybuilder, aged 26 to 27, for six months before and after a contest. As his body fat fell from 14.8 to 4.5 percent, his testosterone dropped from 9.22 to 2.27 ng/mL, his resting heart rate fell from 53 to 27 beats a minute, his mood disturbance score rose from 6 to 43 and his strength went down. Most of it recovered after the contest, but his strength still hadn't fully returned six months later. Stage-lean is a temporary state, not a healthy place to live.
Body Fat Percentage for Athletes
ACE's athlete band is 6 to 13 percent for men and 14 to 20 percent for women. That's a description of where many competitive athletes land, not a requirement for health. Body fat varies widely by sport: endurance and weight-class sports usually run lean, while throwers and some team-sport positions carry more and perform well there.
Remember too that Gallagher's ranges deliberately left out people in vigorous training programs of more than six hours a week. If you train like an athlete, your healthy number may sit below the general chart, and that's fine as long as your energy, sleep, hormones and, for women, your menstrual cycle stay normal. If any of those slip, the number is too low for you.
At What Body Fat Percentage Do Abs Show?
Our guide to how to get abs puts a visible four-pack at rest at roughly 12 to 14 percent body fat for most men and 20 to 24 percent for most women. That's an observation from practice rather than a study result, because nobody has scanned people at every percentage and recorded when their abs appeared. Genetics decides how much of your fat sits on your stomach, and the measuring error on most methods is bigger than the gap between a faint outline and a defined six-pack.
Compare those figures with the healthy ranges above. For men, they sit well within the range. For women, they land at its lower edge. That's why many women find abs harder to keep than to reach, and why abs aren't a sign of health on their own.
What This Means for You
If your number falls inside the healthy range for your age and sex, you don't need to chase single digits. If it's above the range, you don't need a dramatic overhaul either. A few points down over several months, measured the same way each time, is real progress, and it moves you toward the lower-risk end of the charts.
What decides whether that happens isn't the chart you pick. It's whether you're still training in month four, when the first easy wins have slowed. Plans that rely on willpower tend to fade by then. Plans that make each session easy to start, short enough to fit a bad day and rewarding to repeat tend to last. As Katie put it: "I've tried everything. This is the first time I've stuck with something past two weeks."
Frequently Asked Questions
What is a good body fat percentage for my age?
Using the Gallagher ranges, a healthy body fat percentage is about 8 to 20 percent for men and 21 to 33 percent for women aged 20 to 39, 11 to 22 and 23 to 34 percent at 40 to 59, and 13 to 25 and 24 to 36 percent at 60 to 79. The upper number in each range is where the overweight band begins.
What is the body fat percentage chart?
The most widely used chart is the American Council on Exercise's. For women it lists essential fat at 10 to 13 percent, athletes at 14 to 20, fitness at 21 to 24, acceptable at 25 to 31 and obesity at 32 percent or more. For men the same bands are 2 to 5, 6 to 13, 14 to 17, 18 to 24 and 25 percent or more.
Is a body fat percentage of 27.2 considered good for a woman?
Yes. A body fat percentage of 27.2 sits inside the healthy range for women of every adult age in the Gallagher table, and inside the American Council on Exercise's acceptable band of 25 to 31 percent. It's also well below the US average for women, which is about 40 percent on DXA scans.
Is 25% body fat chubby?
It depends on your sex. For a woman, 25 percent body fat is in the healthy range at any adult age. For a man aged 20 to 39, 25 percent is where the Gallagher table starts the obese range and where the American Council on Exercise starts obesity, though for men aged 40 and over it falls in the overweight band.
What's the best way to measure body fat?
A DXA scan is the most practical accurate option, and repeat scans on the same machine agree within about 1 percent. At home, a tape-based formula or a bioimpedance scale is fine for tracking change if you measure under the same conditions each time. Expect any home method to miss your true number by several percentage points.
How is body fat percentage calculated?
Body fat percentage is your fat mass divided by your total body weight, times 100. A 180-pound man carrying 36 pounds of fat is at 20 percent. Because nobody can weigh their fat directly, every method estimates it, from X-ray tissue scans and electrical currents to skinfold thickness and tape measurements of the neck, waist and hips.
What is a normal body fat mass?
Normal body fat mass depends on your weight, so convert the percentage ranges into pounds or kilograms. A 150-pound woman aged 30 in the healthy range of about 21 to 33 percent carries roughly 32 to 49 pounds of fat. A 180-pound man aged 30 in the range of about 8 to 20 percent carries roughly 14 to 36 pounds.